Display statistical information based on the stored weld data

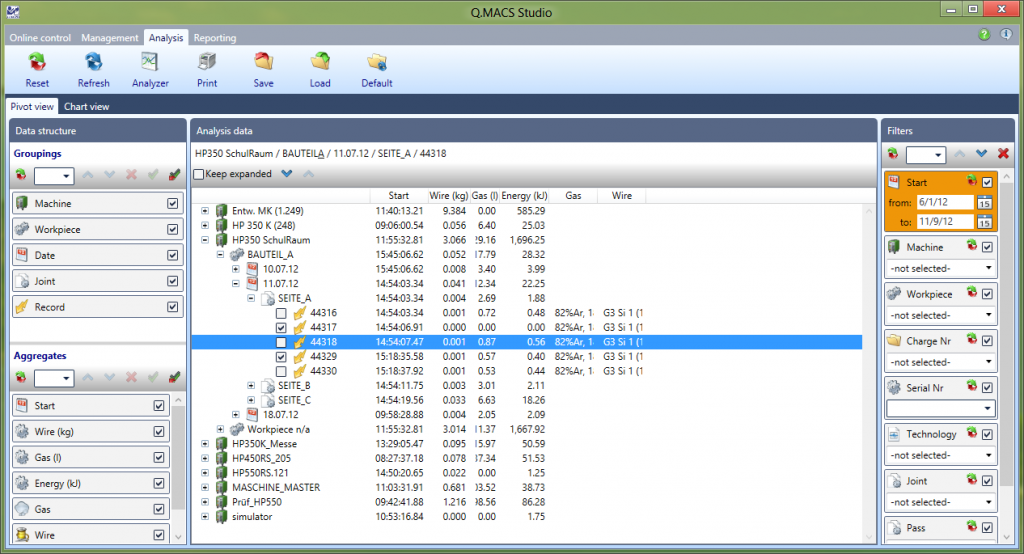
Analysis panel. Pivot view
The Q.MACS Analysis Module gives you the opportunity:
- to display the statistics of produced welds as a pivot table or as a diagram
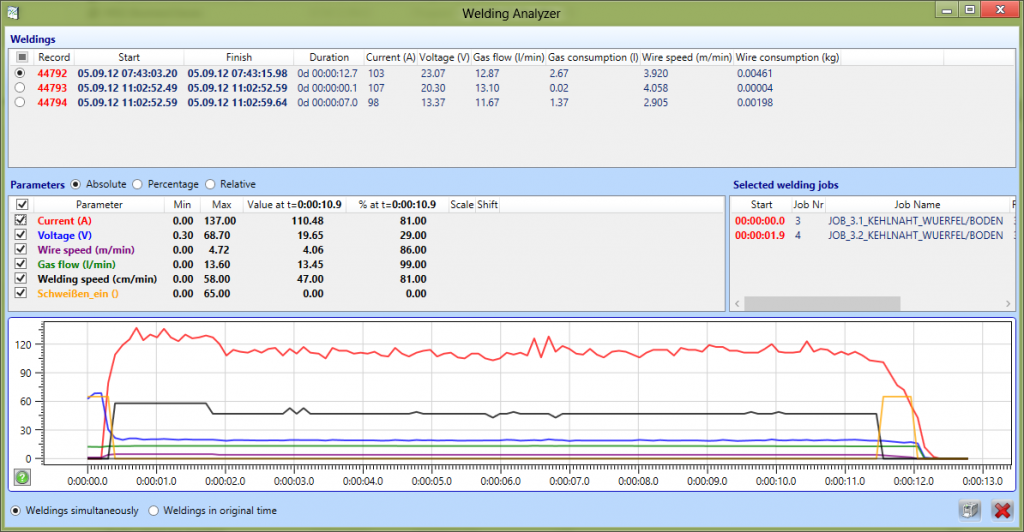
- analyze the diagrams of the parameters for the individual welds
- generate reports based on the selected data
Here you get the special tools for working with analytical data:
- Filters – for the selection of data according to specific criteria
- Groupings – to adjust the structure of the data representation
- Aggregates – to select analytical parameters
You can add, delete, move, enable or disable filters, groups and aggregates.
Based on the obtained statistics, you can generate a report.
For a detailed analysis of individual weld parameters use a special tool – Weld analyzer.

Weld analyzer
